What does Break-even calculate?
Here is a Break-even chart. It represents a 24 day period.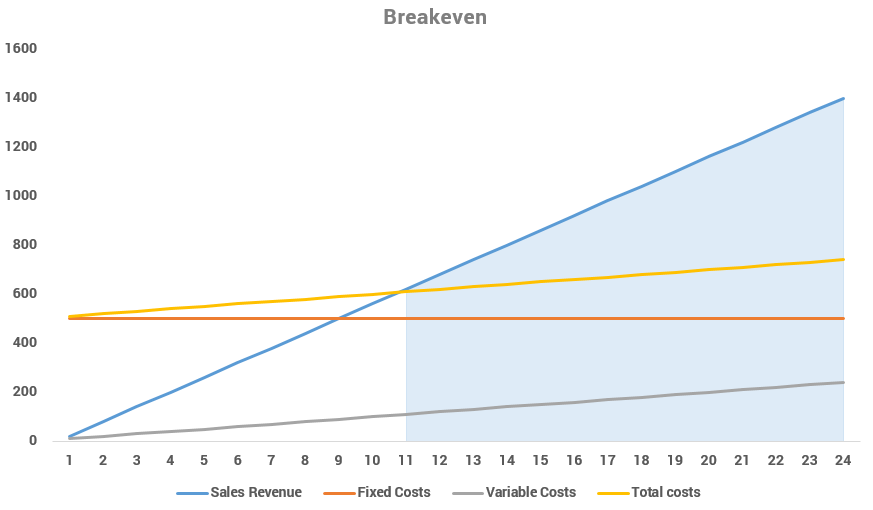
Break-even is when a business is not making any losses or profit, seen in the chart above at 11 days. It can be seen that the yellow total costs line, is the same angle as the variable costs line, plus fixed costs. It also can be determined, that the blue shaded are represents the magin of safety as after that all costs are paid.
What is Margin of Safety?
The margin of safety is how much additional units you have sold in a given period. For example, in the graph below, we are on our 18th day.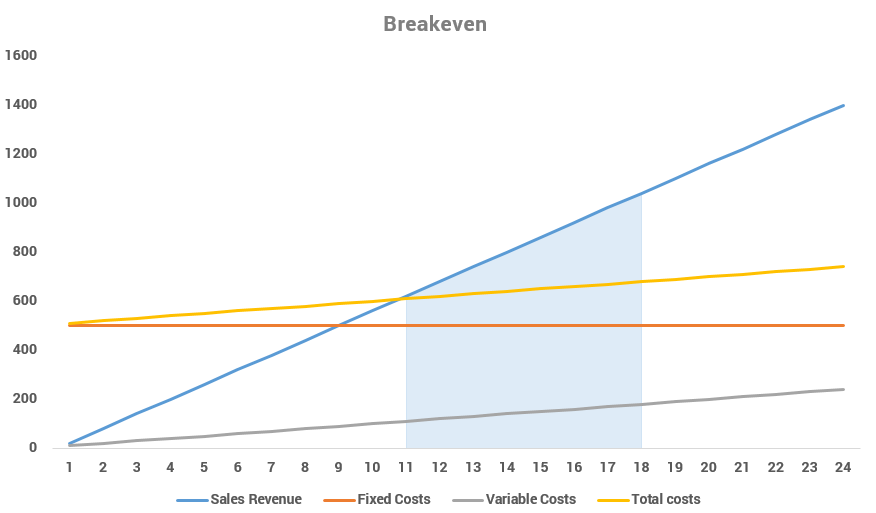
On this day we have spent approximately $680 since day 1, and by day 18, we have made $1040 revenue, so our margin of safety is $1040-$680= $360, however margin of safety does not work in money so we need to convert it back to units, so if each unit sells for $10, then our margin of safety is 36 units.
What is Break-even useful for? (Advantages and Disadvantages)
- The point at which you aren't making any losses or profit.
- It allows you to identify problems you may face with cash flow on new investments, for example;
- Investing in a more expensive warehouse may not be financially viable, as the investment would create a small margin of safety.
- Increasing variable cost may make break-even harder to achieve.
- It allows a business to 'relax' it's workload after it has reached it's margin of safety, as it no longer needs to cover costs. Everything made past the break-even point is profit.
- It may allow an entrepreneur identify where they may want to take risks.
- It also allows an entrepreneur to identify when a theorised project is not financially viable.
- It focuses on what output is required before a business reaches profitability
- Helps management and Finance providers better understand the viability of a risk or business idea.
- It does not cater for potential changes in the moment
- Unrealistic assumptions that everything stays the same.
- It is more of a planning aid, than a decision tool.
How is Break-even calculated?
Break-even Output = Fixed Costs / Contribution per unit
Contribution per unit = Selling price per unit - Variable cost per unit

or

Contribution per unit = Contribution per unit x Number of units sold